Advantage Gold™ Screenshots
Advantage Gold is Smart Luck's newest lottery strategy software. These are just a few sample screenshots to show the program's new Windows interface and is not representative of all the options in the program.

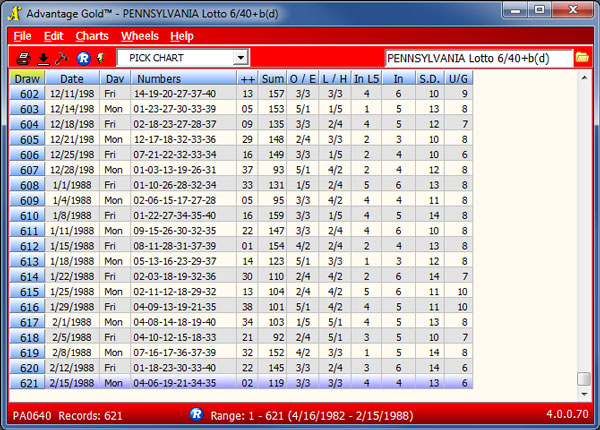
This screenshot shows the Main Menu and drawing edit screen.

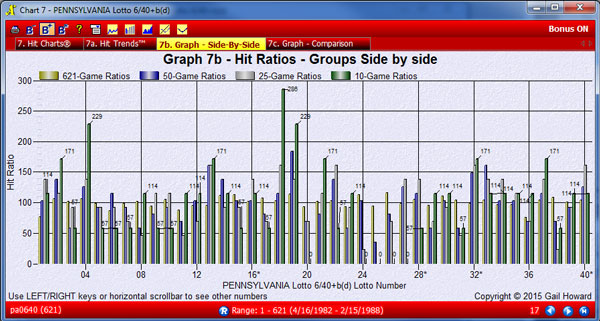
This screenshot shows a subchart of Chart 7, the Hit Charts. 7B is a side-by-side graph that displays the hit ratios for each lotto number for the past 10, 25, and 50 drawings as well as the all-time history. See the buttons towards the top that display different types of graphs - the graph can be changed to display in a number of formats.

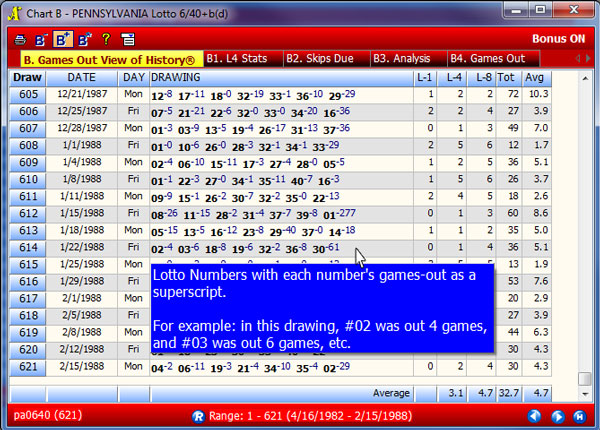
This screenshot shows Chart B, the Games Out View of History. Advantage Gold displays the games out value right next to each number in the drawing (in blue superscript), so it is easier to find which values correspond to which numbers. The blue box displays the hover text when you move the mouse over a field in a chart. This hover text is available throughout the program and explains more details about what the data tells you, and hover text can be turned on or off.

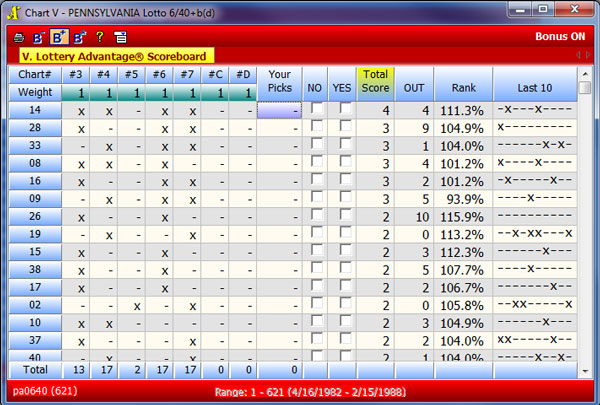
This screenshot shows Chart V, the Lottery Advantage Scoreboard. This chart shows you how the numbers did across all the Smart Pick charts that you ran. If a number was Smart Picked for a chart, it will show an x under the chart number. The numbers with the highest score on the charts show first (by default, but you can sort by number if you prefer), and are the numbers the program will show you first if you use the Smart Picks Chart W. If you have favorite charts you think are more important, you can change the weights of them so the program will rank numbers picked for that chart higher. You can also select No or Yes by a number to force include or exclude it from your number selections.
- ORDER (M-F 8am-5pm EST): 1-727-441-8906
- TECH SUPPORT (M-F 1pm-5pm EST): 1-727-441-8714


 CART
CART